Wisconsin Water Monitoring
The DNR monitors aquatic resources to assess ecosystem health, evaluate environmental problems and determine the success of management actions.
The state's monitoring strategy (see below) directs data gathering to support management decisions; the results of this work are summarized in the bi-annual Clean Water Act Integrated Report.
Monitoring Strategy
Monitoring Strategy (2021-2025)
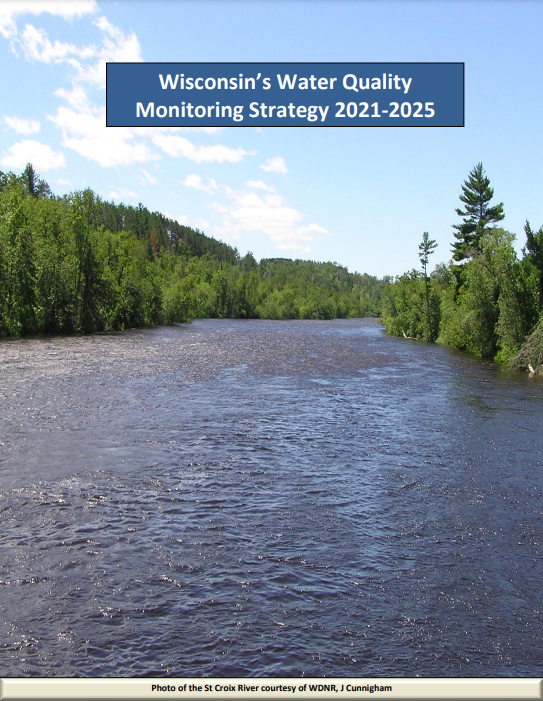
The 2021 update to Wisconsin’s Water Quality Monitoring Strategy presents DNR’s vision to fulfill Wisconsin’s Clean Water Act (CWA) monitoring responsibilities. This strategy supports our statewide commitment to protecting and improving water quality through monitoring that is structurally integrated with waterbody assessments and management needs across multiple water programs. The 2015 update to the Monitoring Strategy provided many substantial changes to Wisconsin’ Monitoring programs. This 2021 update provides refinements that build upon the 2015 version. Additionally, the 2021 update provides prioritized “Strategic Shifts” that outline key areas the Monitoring program will focus on implementing and improving over the next five years.
Lakes
Lakes
Wisconsin has ~15,000 lakes, covering ~1.2 million acres. Approximately 13,000 lakes are less than 50 acres, and only ~2,000 are greater than 50 acres. The DNR’s Lakes monitoring focuses on assessing the status of lakes > 100 acres with public boat access.
The list below highlights the primary lake monitoring activities that occur on Wisconsin lakes.
- Volunteer monitoring is the primary vehicle for data collection in Wisconsin. Citizen Lake Monitoring Network (CLMN) volunteers collect Secchi depth data on 670 lakes, chlorophyll-a and phosphorus data on 403 lakes, temperature data on 377 lakes, and dissolved oxygen data on 244 lakes each year. Samples are collected once during spring overturn, and three times during the summer (June to September).
- Satellite images are used to infer water clarity and trophic status on thousands of lakes in Wisconsin. The satellite retrieval of water clarity is limited to lakes ≥ 5 acres in area.
- Water quality monitoring is conducted every year on 62 Long-Term Trend (LTT) lakes statewide to monitor trends over time. Most of these long-term records began in 1986.
- Directed Lakes monitoring occurs on approximately 30 new lakes every two years. This monitoring effort establishes baseline conditions on lakes without recent data for assessment and management needs. A variety of lake information is collected, including: water quality, aquatic plant, aquatic invasive species, and optionally lakeshore habitat.
- The National Lakes Assessment estimates the condition of all lakes in Wisconsin every five years. Working with the Environmental Protection Agency, the DNR surveys a wide variety of parameters on 50 randomly selected lakes that represent the statewide population of lakes.
- Lake planning and protection grants also design and collect water quality data. Trophic status is determined from summer average field-collected Secchi depth or chlorophyll-a, and is used for primary lake assessment.
Rivers and Streams
Rivers and streams
Wisconsin is home to roughly 88,000 miles of streams and rivers for which the DNR is charged with monitoring for status and trends. The DNR developed a Surface Water Monitoring Strategy that guides efforts that strive to efficiently and effectively provide data for a wide variety of regulatory and management needs. DNR's streams and rivers monitoring program aims to provide water quality data that answers these five major questions:
- What is the overall quality of waters of the state?
-
Given the number of streams and rivers in Wisconsin, the DNR uses a probabilistic monitoring design, which is a random selection of stream locations to be monitored, so that a statistically valid estimate of statewide stream condition can be made from the results. The DNR operates a statewide probabilistic monitoring design as well as participates in the EPA's National Aquatic Resource Surveys.
- To what extent is water quality changing over time?
-
The DNR operates a long-term trend monitoring program that was specifically developed to track and analyze water quality trends across Wisconsin’s large rivers. The monitoring network consists of 43 sites co-located with a USGS streamflow gauge. The earliest monitoring at select sites started in the 1970s, with additional sites added over time so that the watersheds in the network now cover ~80% of the land area of Wisconsin.
- What levels of protection are needed?
-
Under the Clean Water Act framework, Wisconsin develops water quality standards that express the amount of a pollutant that can be in the waterbody where it will still meet its desired condition (i.e. fishable and swimmable). Every two years DNR publishes a list of all the waters that have been assessed and those that do not meet water quality standards in the Impaired Waters list. The monitoring program supports these two programs by developing studies to aid in the creation of new Water Quality Standards, as needed, and collects surface water data so that waterbodies can be assessed under the Impaired Waters program.
- What are the problem areas needing restoration or protection?
-
Waterbodies listed on the Impaired Waters are prioritized for restoration activities such as Total Maximum Daily Loads (TMDLs). The TMDL is essentially budget for a waterbody describing the amount of a pollutant that needs to be reduced. The monitoring program supports the TMDL program by providing surface water chemistry and discharge data to develop the TMDL watershed model. Monitoring data also support partner agencies that may write their own restoration plans such as US EPA’s Nine Key Element Plans.
- How effective are restoration and protection projects and programs?
-
Lastly, the monitoring program supports other DNR management and regulatory programs by providing data that can be used to inform the effectiveness of previous actions. One such activity is the DNR Nutrient Reduction Strategy, which developed in 2013 measures and reports on the progress made to reduce nutrient loading to the Mississippi River.
Wetlands
Wetlands
Wisconsin has lost about half its wetlands in the last two centuries. In order to better understand the location and quality of Wisconsin’s remaining wetlands, we employ various tools to monitor and assess wetlands throughout the state. The results of these efforts inform restoration efforts, wetland policy and watershed planning.
Wetland monitoring efforts utilize a three-tier approach as supported by the EPA's National Wetlands Monitoring Workgroup:
- Level 1: A landscape assessment. Relies on coarse, landscape-scale inventory data typically gathered by remote sensing.
- Level 2: A rapid assessment. Consists of relatively simple rapid protocols to be conducted at specific sites.
- Level 3: An intensive site assessment that uses intensive ecological measures to score the relative condition of a site based on research-derived indices of biological integrity.
Monitoring wetlands to assess their biological health and the services they provide can help to answer some of these important questions and provide information for good decision-making.
Beaches
Beaches
Wisconsin has approximately 55 miles of public beach and a total of 192 coastal beaches along the shores of Lake Michigan and Superior. The federal Beaches Environmental Assessment and Coastal Health (BEACH) Act, was passed in October 2000. The BEACH Act requires states that border the Great Lakes or other coastal areas to develop beach monitoring programs and a process for notifying the public about beach conditions. Wisconsin receives an annual allotment from USEPA to continue developing and implementing Wisconsin's Beach Monitoring and Notification Program.
Wisconsin Beach Monitoring and Notification Program was developed to reduce the risk of exposure of beach users to disease-causing microorganisms in water. Wisconsin was one of the first states to develop its program in 2003 and has been a model program for other states. Selected beaches along the Great Lakes are monitored for E. coli bacteria in accordance with BEACH Act requirements from Memorial Day Weekend through Labor Day Weekend (approximately 14 weeks) each year.
Wisconsin DNR works closely with approximately 16 local health departments, university researchers, the State Lab of Hygiene and the United States Geological Survey (USGS) to regularly monitor and provide online notification of advisories for approximately 107 sites along the shorelines of Lake Michigan and Lake Superior.
Inland beaches
The DNR monitors 21 state parks beaches for E. coli bacteria each year from Memorial Day weekend through Labor Day following the Great Lakes beach monitoring protocol. Beach monitoring and advisory results can be found on the Wisconsin Beach Health website. Local health departments also sample for E. coli bacteria each year on inland beaches throughout the state, and DNR cooperates with these departments to post monitoring results and advisory information the Wisconsin Beach Health website as requested.
Protocols
Lake Protocols
Lake Water Quality
- Protocols
- Data Sheets
Lakeshore Habitat
- Protocol
- Data Sheets
Lake Levels