Groundwater quantity
GCC Report to the Legislature
Groundwater is abundant in Wisconsin and available in sufficient amounts throughout most of the state. Groundwater provides adequate water supplies for most municipal, industrial, agricultural and domestic uses. However, groundwater pumping can lower water levels in an aquifer and in certain settings reduce groundwater discharge to surface water bodies connected to the aquifer.
Water quantity trends and topics
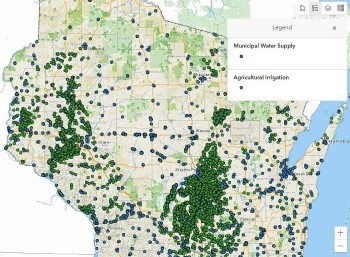
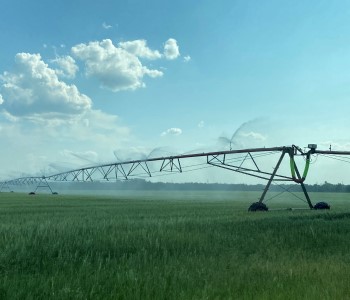
Water useThe Water Use StoryMap showed that the largest category of groundwater withdrawals was municipal public water supplies. The second largest category of groundwater withdrawal in the state was agricultural irrigation. Agricultural irrigation water use varies from year to year depending on the timing of rainfall during the growing season. » Read more. |
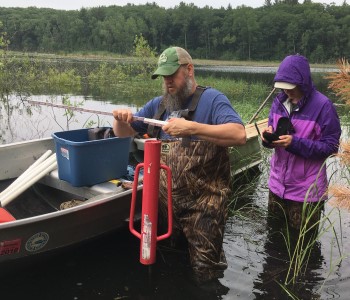
Central Sands Lakes StudyUnder 2017 Wisconsin Act 10, the legislature requested that the DNR evaluate and model the potential impacts of groundwater withdrawals on three lakes in Waushara County. The study findings showed that the reduction caused by groundwater withdrawals to study lake levels is a result of the collective impact from many high-capacity wells rather than any specific high-capacity well. » Read more. |
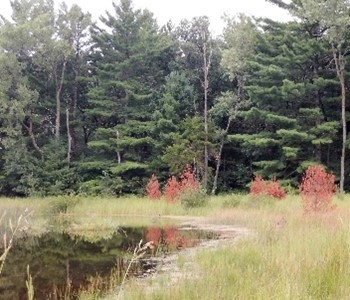
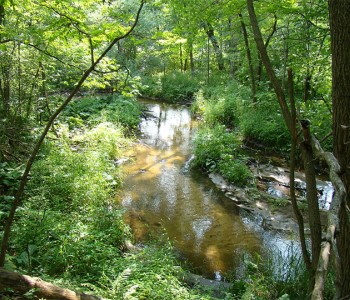
Groundwater/surface water interactionsfluctuating water levels based on groundwater availability. © DNR In many areas of the state groundwater and surface water are well connected, requiring a better understanding of the role water withdrawals have on streamflow and lake water levels. The Water Use Monitoring StoryMap explains how we gather the necessary information to understand how groundwater and surface water are connected. » Read more. |
Regional drawdownsSeveral areas of Wisconsin have seen regional drawdowns of the groundwater due to extensive groundwater withdrawals. These drawdowns can affect water availability and water quality. » Read more. |
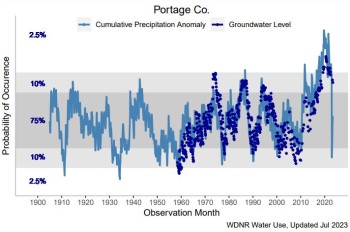
Groundwater level fluctuationsterm average in Portage County shows above- average precipitation in recent years, returning to average precipitation, with declining, but still above average groundwater levels. DNR staff track recent and historical precipitation and compare that data to long-term averages to characterize and identify trends. We compare these precipitation patterns to water level readings in monitoring wells around the state. Groundwater levels were at or near all-time highs in 2020 and 2021. Since 2021, groundwater levels have started to decline following a period of more typical precipitation amounts (2022) to below-average precipitation amounts (spring, early summer 2023). » Read more. |
Water quantity tools and strategies
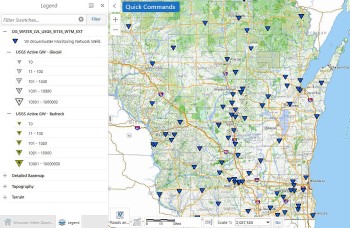
Statewide groundwater level networkhas been operated jointly by WGNHS and USGS since 1946. Water levels collected from the network help scientists and managers evaluate effects of well pumping, the response of groundwater levels to drought or increased precipitation and effects of land-use change on groundwater resources. » Read more. |
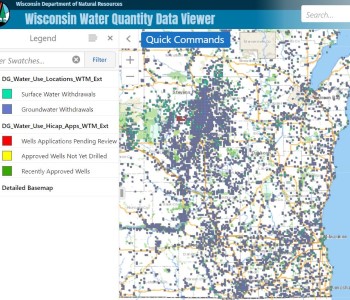
Water use dataThe DNR's interactive map viewer allows the public to access information about approved surface and groundwater withdrawals, existing and pending high capacity wells, water quantity monitoring by various agencies and locations of groundwater protection features throughout Wisconsin. The DNR's water use search tool allows users to find individual or aggregate water withdrawals from high-capacity wells and surface water withdrawals. » Wisconsin Water Quantity Data Viewer |
Little Plover River Model and Watershed Enhancement ProjectA state-of-the-art groundwater flow model was developed as a tool for understanding the interactions between groundwater withdrawals and streamflow in the Little Plover River basin in Wisconsin's Central Sands region. As stakeholders work together to evaluate management options to ensure sustained flows in the river, the model allows “what-if” evaluations of possible water use or land-use changes. » Read more. |

